To get to T2D3 exponential growth, you are likely investing increasingly more money into demand generation and conversion optimization. These efforts will not have the desired effects unless you also patch the leaks in your funnel.
What churn rates are acceptable? This varies per industry, ACV, and maturity of the category you are in (and your own product’s maturity to reach PMF). Here are some typical churn numbers by customer segment:
|
Segment
|
Monthly churn
|
Annual churn
|
|
SMB
|
3-7%
|
31-58%
|
|
Mid-Market
|
1-2%
|
11-22%
|
|
Enterprise
|
0.5-1%
|
6-10%
|
SaaS companies that cannot decrease churn to acceptable levels will not make it, eventually losing to the competition. You need to track both customer churn (sometimes called “logo churn”) and revenue churn. Typical churn can also vary across your own customer base, for example by customer size.
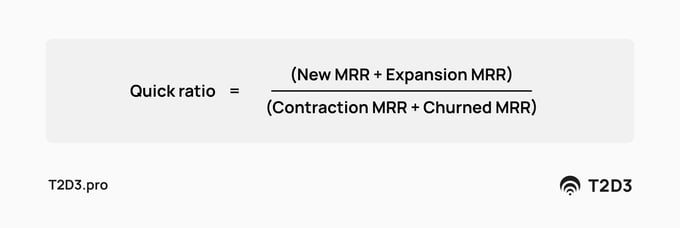
Industry analysts and investors have come up with a rule of thumb called the “quick ratio” (QR) based on what is happening with monthly recurring revenue (MRR). It is a way to measure how efficient the growth of a SaaS company is. A low number means a disproportionate amount of your revenue is leaking away each month through either customer churn, or revenue contraction per customer. You cannot sustain this. Healthy SaaS companies have a QR that is higher than 4.

Engaged advocates
Your existing customers are not just valuable for the revenue they produce for your company now, but also for the potential new customers they can attract. They trust your company and value what you are offering.
Ideally, your users and customers become engaged advocates. They use your product, tell others about it, drive interest and adoption by others through testimonials, videos, case studies, success stories, and more. These are customers that not only use your product or service but are actively involved in promoting it. The more customers who are engaged with your offering, the less churn you will have.
Three churn-reduction attributes
Here are some examples of what you can measure for each attribute and how to drive them:
1. Product usage KPIs
- Frequency of logins, especially after initial onboarding
- Support tickets, calls, or chats
- Data entry into your system (high volume drives stickiness and value)
Drive product usage by creating a user onboarding program. Share tips to get more out of the product in weekly newsletters. Have your customer success team check-in with new customers, ideally using the usage data you track.
2. User satisfaction KPIs
- NPS (Net Promoter Score)
- In-product ways to measure which features users like
- ARPU expansion (do they buy more?)
Drive user satisfaction through constant product improvements using user feedback. Connect with them through low-friction customer service (with the channel of the user’s choice), upsell popular features that they do not yet use. Get the right plan for the right customer.
3. Promotion KPIs
- Referrals of new paying customers
- Customer references and testimonials
Drive promotion by your engaged advocates by asking for referrals, making it easy to share reviews, and writing up case studies. If you can get your customers to use, like, and share your solution, you are on your way to great churn reduction. Given the importance of this growth lever, the next section is dedicated to this.
Build your customer growth flywheel
Your customers are your greatest asset, and you need to use your customer relationship “equity” tokens carefully—you only have a few with each happy customer. Marketing to your existing customer base is critical. A well-thought-out customer nurture and retention program is one of the most important campaigns to create early.
As a refresher, it is critical to think about your customer marketing program holistically. Customer marketing is not solely the responsibility of the marketing team. It should become a part of your company’s culture—including your sales, customer success, and account management teams. The outcomes that a comprehensive, well-executed customer marketing program can drive are significant.